Compare similarity measures - EBI_Expression_Atlas_MsigDB_C3_MIR_Legacy


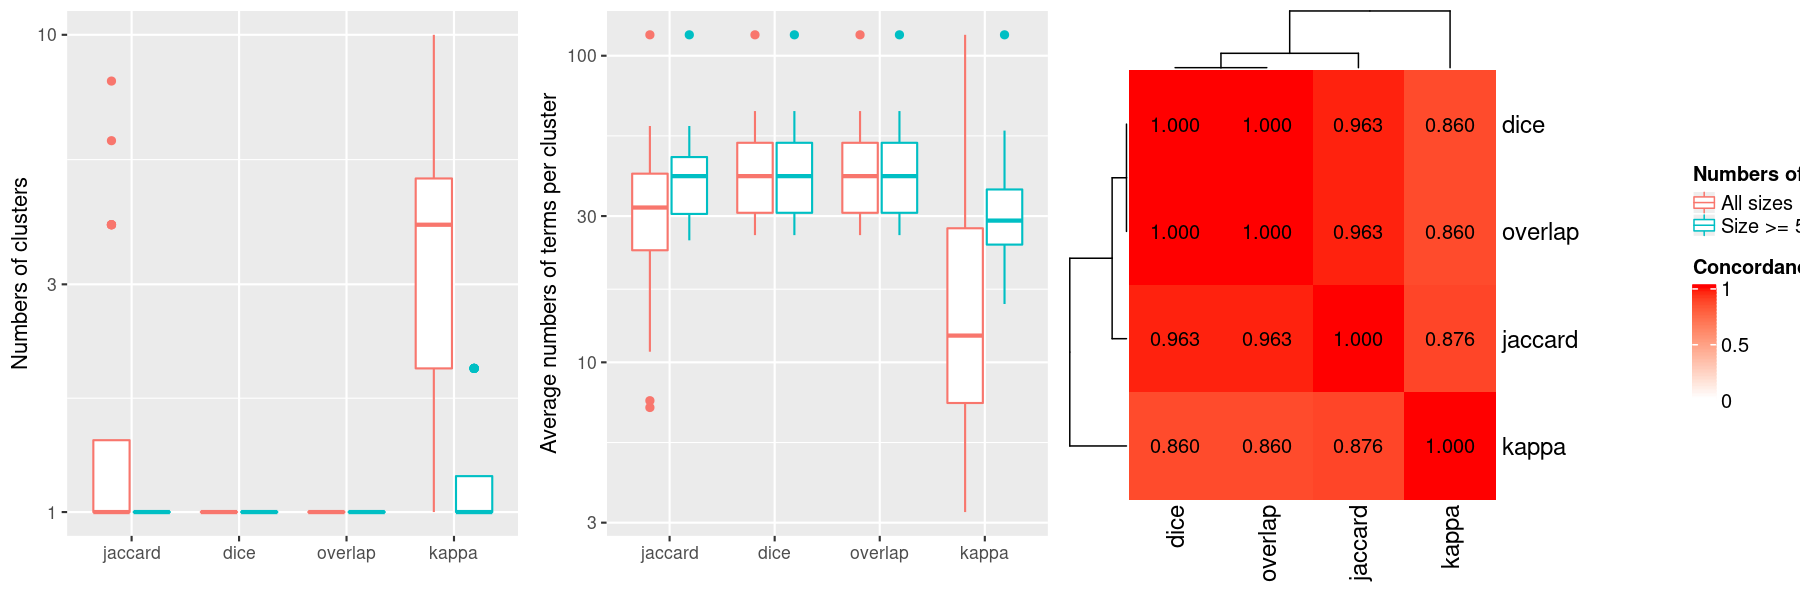
Figure 1. Left) Numbers of clusters. Middle) Average numbers of terms per cluster. Right) Concordance of clusterings from different similarity matrices. The definition of the concordance score can be found here.


Figure 2.Numbers of clusters.


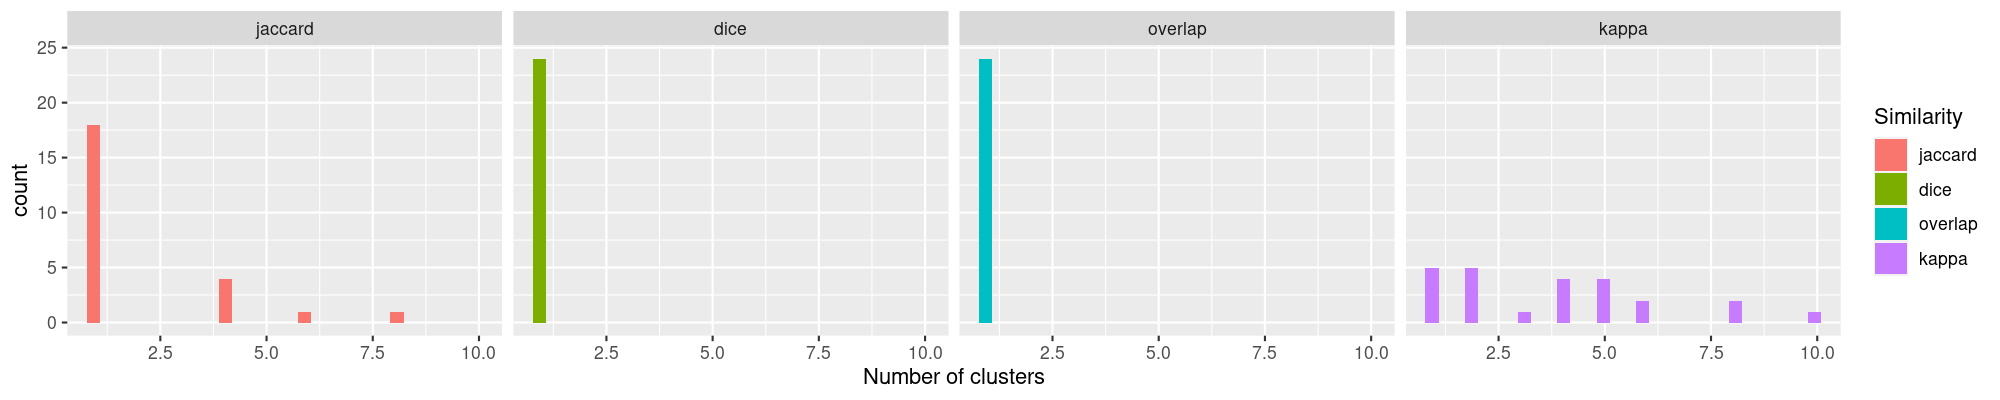
Figure 3.Numbers of large clusters (size >= 5).


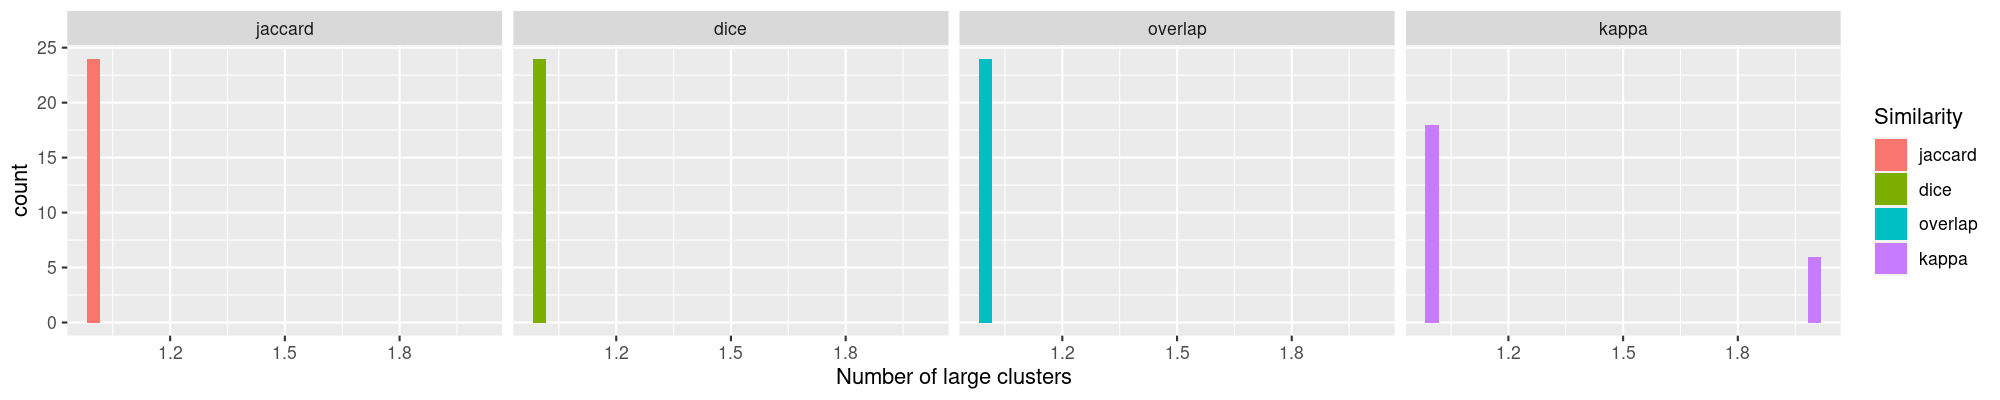
Figure 4.Proportion of the largest cluster.


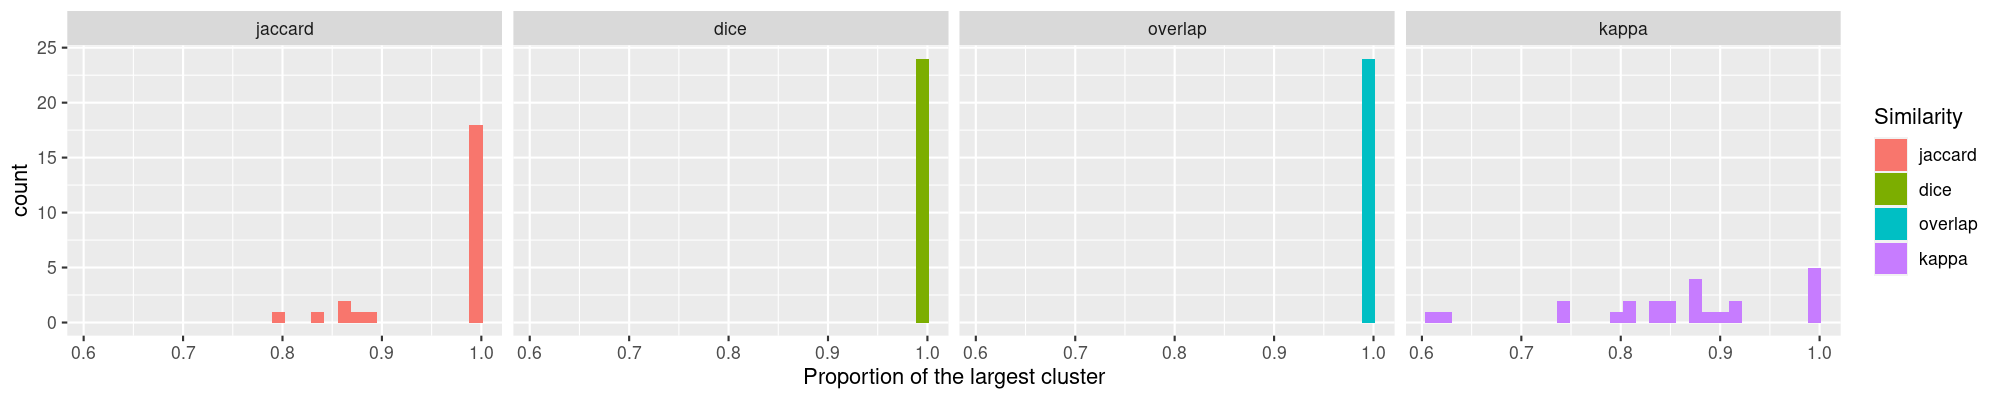
Table 1. Details on individual datasets.

E-GEOD-13637_A-AFFY-44_g1_g2 E-GEOD-13637_A-AFFY-44_g1_g9 E-GEOD-13637_A-AFFY-44_g5_g3 E-GEOD-1417_A-AFFY-33_g1_g2 E-GEOD-16837_A-AFFY-44_g22_g11
E-GEOD-16837_A-AFFY-44_g22_g21 E-GEOD-16837_A-AFFY-44_g22_g29 E-GEOD-19018_A-AFFY-44_g2_g1 E-GEOD-24592_A-AFFY-37_g1_g3 E-GEOD-44384_g1_g2
E-GEOD-46538_A-AFFY-44_g3_g1 E-GEOD-50694_A-AFFY-37_g5_g4 E-GEOD-51258_A-AFFY-44_g1_g2 E-GEOD-56788_g2_g12 E-GEOD-57463_A-AFFY-44_g2_g1
E-MEXP-1372_A-AFFY-44_g4_g2 E-MTAB-3447_g5_g3 E-MTAB-3731_A-AFFY-33_g4_g12 E-MTAB-4732_g2_g1 E-MTAB-6345_g1_g2
E-MTAB-6681_g6_g4 E-MTAB-7000_g1_g2 E-MTAB-7000_g3_g4 E-MTAB-8215_g1_g2